What can a Lorry tell us about Tumour Immunology?
Written by Zak Kinsella
Published 21st July 2022
I have today the bittersweet pleasure of writing about my work to a wider audience. Sweet, because I have you - the readers - interested in the workings and wider research of myself, which is an honour and particularly cool if I do say so. Bitter, as my field’s writing style is known to be one of the most potent soporifics around, so I have to try and wrestle with that. Off to a good start, let’s see if I can bring you on the journey through my work. In a worst-case scenario, you have some content to hand that can put you to sleep no matter the circumstance!
To begin then, I’ll try to paint a picture. A tumour is much like a city. No, not in that way…but more so an environment of closely related processes, each working together, relying on the other, with traffic moving between its parts, a purpose in mind, to form a wider structure that we give a name. My research is focussed on deciphering the significance of these cityscapes and the purpose of particular neighbourhoods within – often called the ‘tumour microenvironment’. Many happenings occur in these neighbourhoods, and it is only relatively recently that research is beginning to peer into and unfold the meaning behind them. The example that I hope to explain today is one on the importance of traffic into and out of the breast cancer microenvironment. In particular, the immune system as traffic (Figure 1), and what we are trying to do in understanding how these metaphorical HGVs and their mileage affect the city; with hope that this information can be used in clinical practice to aid and support patient outcome decisions.
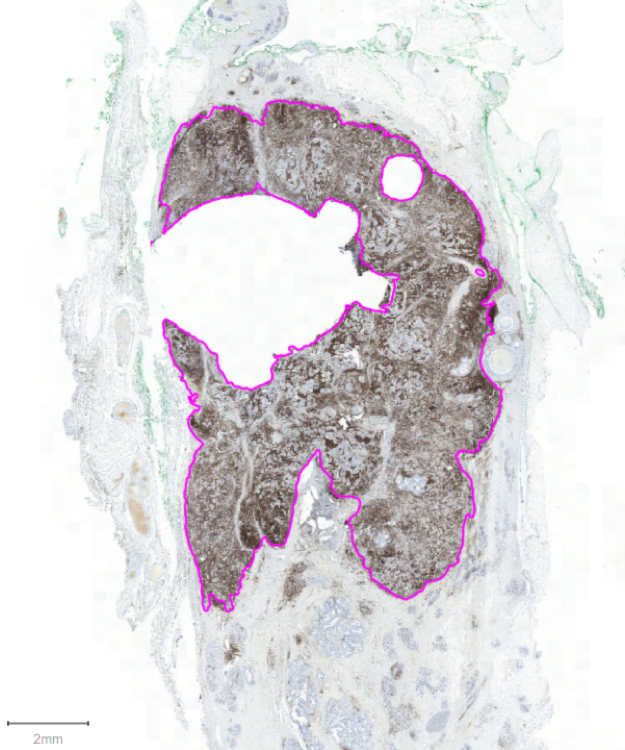
Figure 1. An example of a patient's breast cancer. Purple annotations show the border between invasive and non-invasive tumour area. The high volume of brown staining is indicative of large immune traffic through this tumour. Stained with CD45 (DAB, brown), counterstained with haematoxylin.
HGVs are curious things, though. On the one hand, their purpose is to supply behind the scenes the necessary bits and bobs for the effective continuance of the cities. On the other, they’re not very capable at doing this and instead are very effective roadblocks of the motorway systems. Likewise, in our bodies it is known that our immune system supplies a useful function, performed in the background unknown to us, by eradicating many cancers in their infancies. It only fails to do so when demand is highest, and the system is stressed continually. This causes what is known as ‘immune escape’, where be it by genetic alterations or other complex interactions, the tumour figures out a way of avoiding traffic jams, or else uses them to its advantage. The immune system is then rather like these HGVs, but we need to understand their effects.
In order to decode the traffic of the city, we need to know which HGVs are most useful to the city. But how do we label them - the useful and the not-so-much? Where are the HGVs going? Are there any ports or docks - areas particularly high/low in HGV density? What else could be key to HGV transport? To answer these questions, we must create a map of their positions and interactions.
According to an extensive 30 second Wikipedia search, a cartographer ‘…must typically collect, measure, and interpret data to create and update maps’. In the lab, we begin our mapping process by taking thinly sliced patient tumour tissue and staining it with a chemical dye specific to the HGV of interest. We add other dyes too, that allow us to collect a view of city architecture – the invasive tumour tissue and non-invasive tumour tissue. We then take satellite-like photographs at high resolution that allow us to see the city from a birds-eye view (Figure 2).
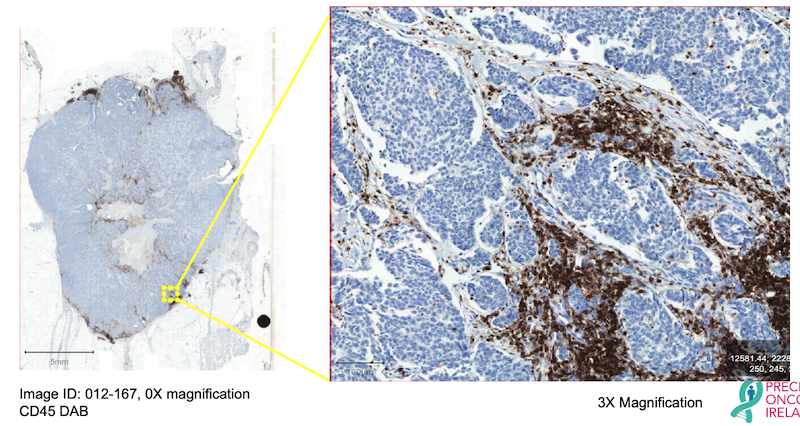
Figure 2. An example high-resolution image of ER+ Breast Cancer stained with the pan-immune marker CD45 (brown), counterstained with haematoxylin (blue). Excerpt shows a magnified region of the tumour at 3X magnification.
Traditionally, a trained professional would look at this map, in areas deemed representative of the city, and measure the labelled ‘HGV traffic’ there as a percentage. “This region is covered by 20% of HGVs”, for example. The average percentage of different regions is deemed the ‘score’ for the city. While undoubtedly this is useful, it is not a true reflection of the city’s HGV processes altogether. We must then employ a method that allows us the ability to see all HGV processes, all at once, all over the city. Only this way can we begin to pry out more crucial information on what our HGVs actually mean. To achieve this, we use machine learning and what is called ‘Digital Pathology’ on our labelled tumour tissues (Figure 3).
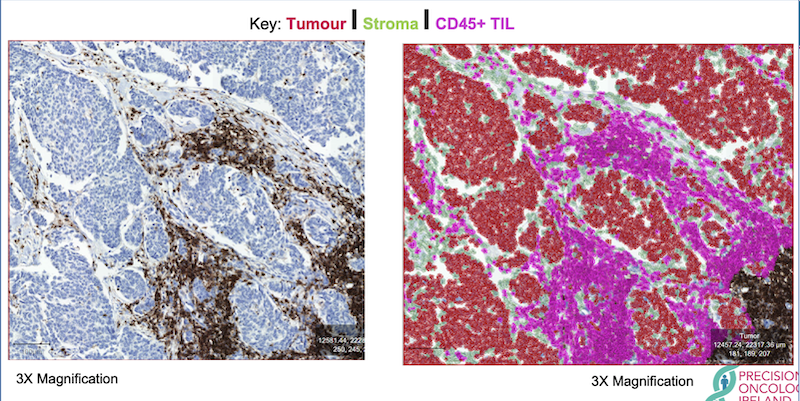
Figure 3. An example of one, trained digital pathology classifier to show location, number, percentage, and density of infiltrating immune cells. Imagine city architecture in red, roads in green, and our coveted HGVs in magenta. Tumour has been stained with CD45 (brown), counterstained with haematoxylin (blue). TIL = tumour infiltrating lymphocyte.
Besides providing pretty pictures, Digital Pathology has the potential to count every crucial piece of information we need, automatically. Like any brain, it first requires training on how to see and use information. Other colleagues and I in Precision Oncology Ireland collaborate with a pathologist – the trained professional – to ensure our training wheels are true and proper guides to the newfound brain. We then, with nervous apprehension, set it running without support and see how it performs. With enough training and guidance, the digital brain becomes quite adept. We continually test performance until we can be sure that falls or crashes, bumps and scars, are kept to a crucial minimum before pushing it off to cycle our birds-eye images for us (Oh, how quickly they grow!). In this way, we can be fairly certain that the results of the algorithm will be similar to our own, however, performed much more quickly and in much greater detail, as counts will be made in the entire image rather than in defined regions within.
Because our digital brain can count every lamppost, every building, every road, every HGV; we receive data that is fully quantitative. We then don’t have to infer how many HGVs there are on average – we now have a very precise number, a co-ordinate location, and a specific type of every HGV encountered in the city. This information can be used in a suite of tests to more accurately tell us the effects of certain HGV traffic, at certain times. Which HGVs are most useful, which not so much. Where HGVs are exactly, and what they may be interacting with (Figure 4).
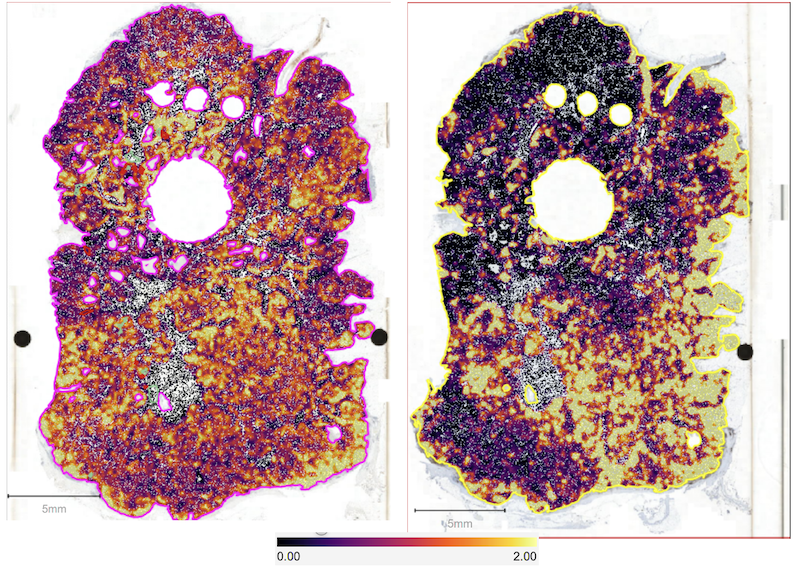
Figure 4. A heatmap of positive markers within two sections of breast cancer from the same patient. Marker density is shown by the key. The left image shows Ki67+ tumour cells - a marker of which tumour cells are actively growing. The right image shows CD45+, a marker of overall immune cells and their ‘neighbourhood’ clustering within the ‘city’ of this tumour.
What we are finding with this technology is that the presence of certain immune cells; their number; their location; whether they talk to each other on the road or avoid one another entirely, can predict how a patient’s breast cancer is likely to develop. The presence of high CD45 in these figures for example – a label of all HGVs as it were – we are beginning to show can predict worse survival chances in a subset of breast cancer patients [1].
Having at hand a map of tumour-immune interaction, with very high resolution, produced automatically, in bulk, rapidly and reproducibly, on every immune cell type in a tumour, is one of the next evolutions in the clinical decision-making process. There are many obstacles to overcome, but we hope and are actively working toward a way to facilitate this process, all to the benefit of breast cancer patients within Ireland and the community at large! Hopefully I have communicated an overview of my work effectively to you, in an interesting and digestible way. Perhaps also this will persuade you to look positively on your next traffic jam, whenever it occurs (it’s always good to end on a joke!).
--
Zak Kinsella is a PhD Student with Precision Oncology Ireland, based in Prof. Darran O'Connor's group in RCSI. His research aims to better understand the impact of immune cells on tumour progression, with a particular focus on breast cancer.
--
References
[1] https://doi.org/10.1200/JCO.2022.40.16_suppl.e12555.